Hi, I'm Rosa
Data Analyst | Data Scientist
My Projects

About Me

Profile Photo
I am a data scientist with a background in chemistry and computer systems engineering. My professional goal is to apply data science and artificial intelligence techniques for natural, environmental, health and educational sciences. I consider myself a person in constant learning.

What I Do

These are the areas I truly enjoy working in.

Data Science

As a Data Analyst / Data Scientist, I have experience collaborating with clients to define business requirements and create data-driven solutions. I specialize in data preparation, exploratory analysis (EDA), and visualization using Python (Pandas, NumPy, Matplotlib, Seaborn, Plotly). Also, I have experience in SQL databases and BI tools like Tableau, Power BI, and Looker to transform data into actionable insights. Additionally, I am exploring the application of Machine Learning (ML) and Artificial Intelligence (AI) techniques.

Python Programming and Web Development

As a Python Programmer and Web Developer, I specialize in building dynamic web applications using Django, Flask, Streamlit and/or Plotly Dash with a focus on interactive data visualizations using Plotly and Bokeh.

My services include developing custom apps, data dashboards and web-based data applications. I am exploring the creation of Artificial Intelligence (AI) applications that integrate into web solutions.

Research and Writing

With a background in chemistry and computer systems engineering, I have experience in both scientific and technical writing and science communication. I specialize in creating clear, concise, and well-researched content that bridges complex technical concepts with a broad audience.

I have a strong interest in researching the applications of Artificial Intelligence and IoT in fields such as biology, chemistry, environmental science, and education.

Portfolio

Below is a selection of personal projects I’ve worked on my free time.

Django & React Coding Tests Platform
A full-stack web application for conducting coding tests/interviews with real-time code execution, automatic grading, and progress tracking. This application was built with Python Django and React (JavaScript).
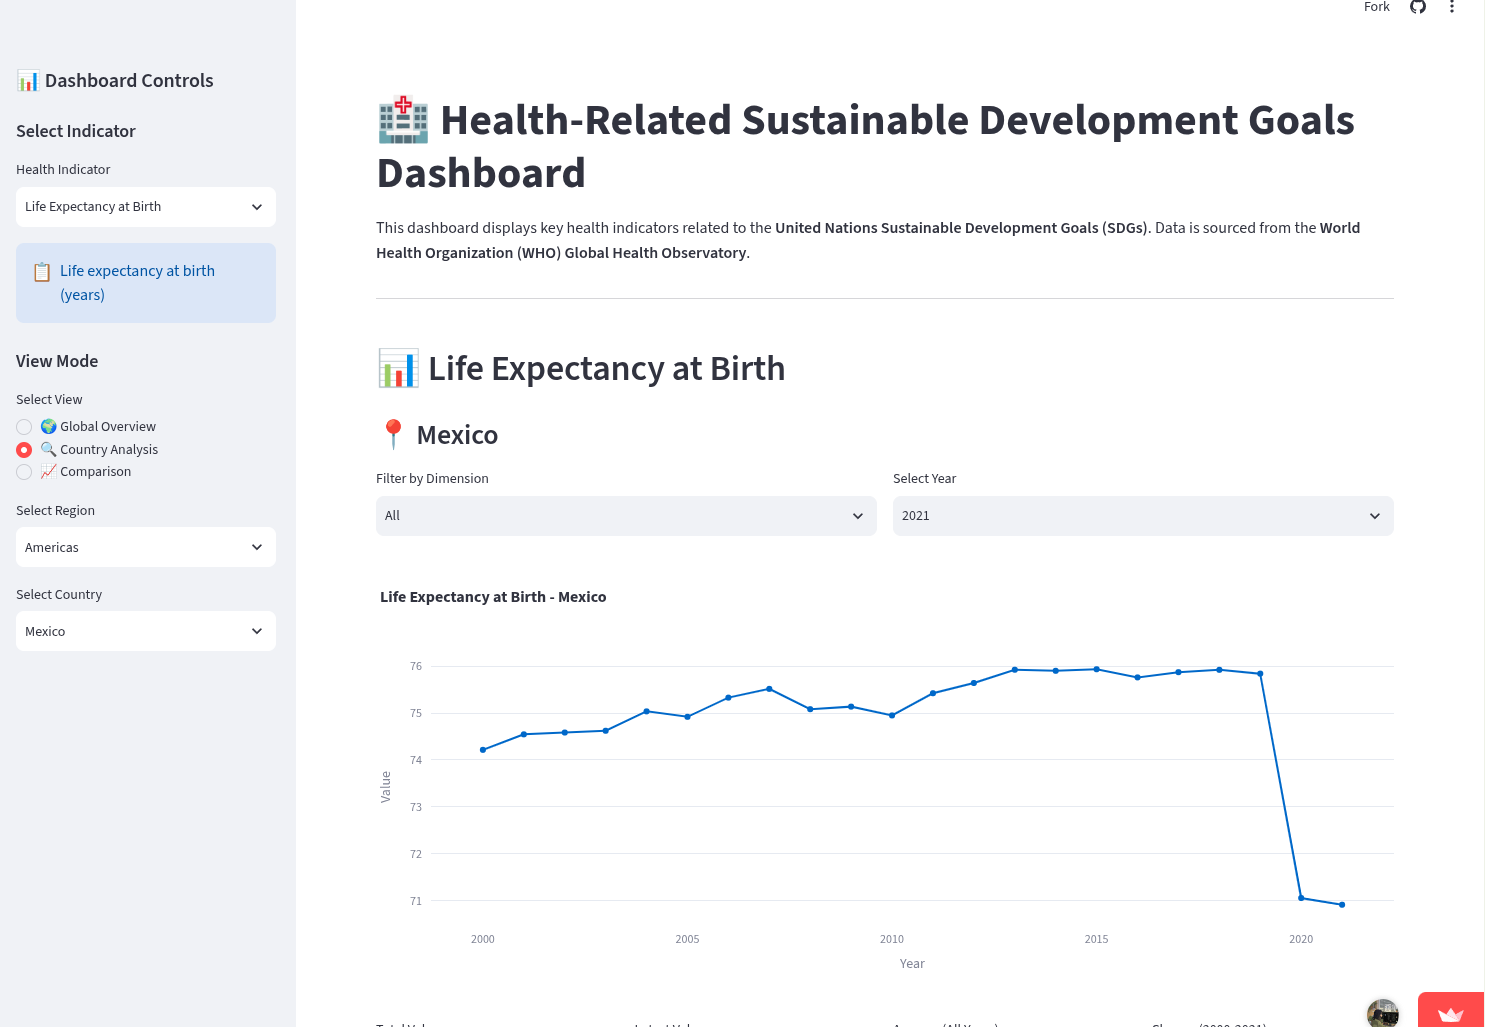
Health-Related Sustainable Development Goals Dashboard
Streamlit - Health-Related Sustainable Development Goals Dashboard
This dashboard displays key health indicators related to the United Nations Sustainable Development Goals (SDGs). Data is fetched in real-time from the World Health Organization (WHO) Global Health Observatory OData API.
Health-Related Sustainable Development Goals Dashboard
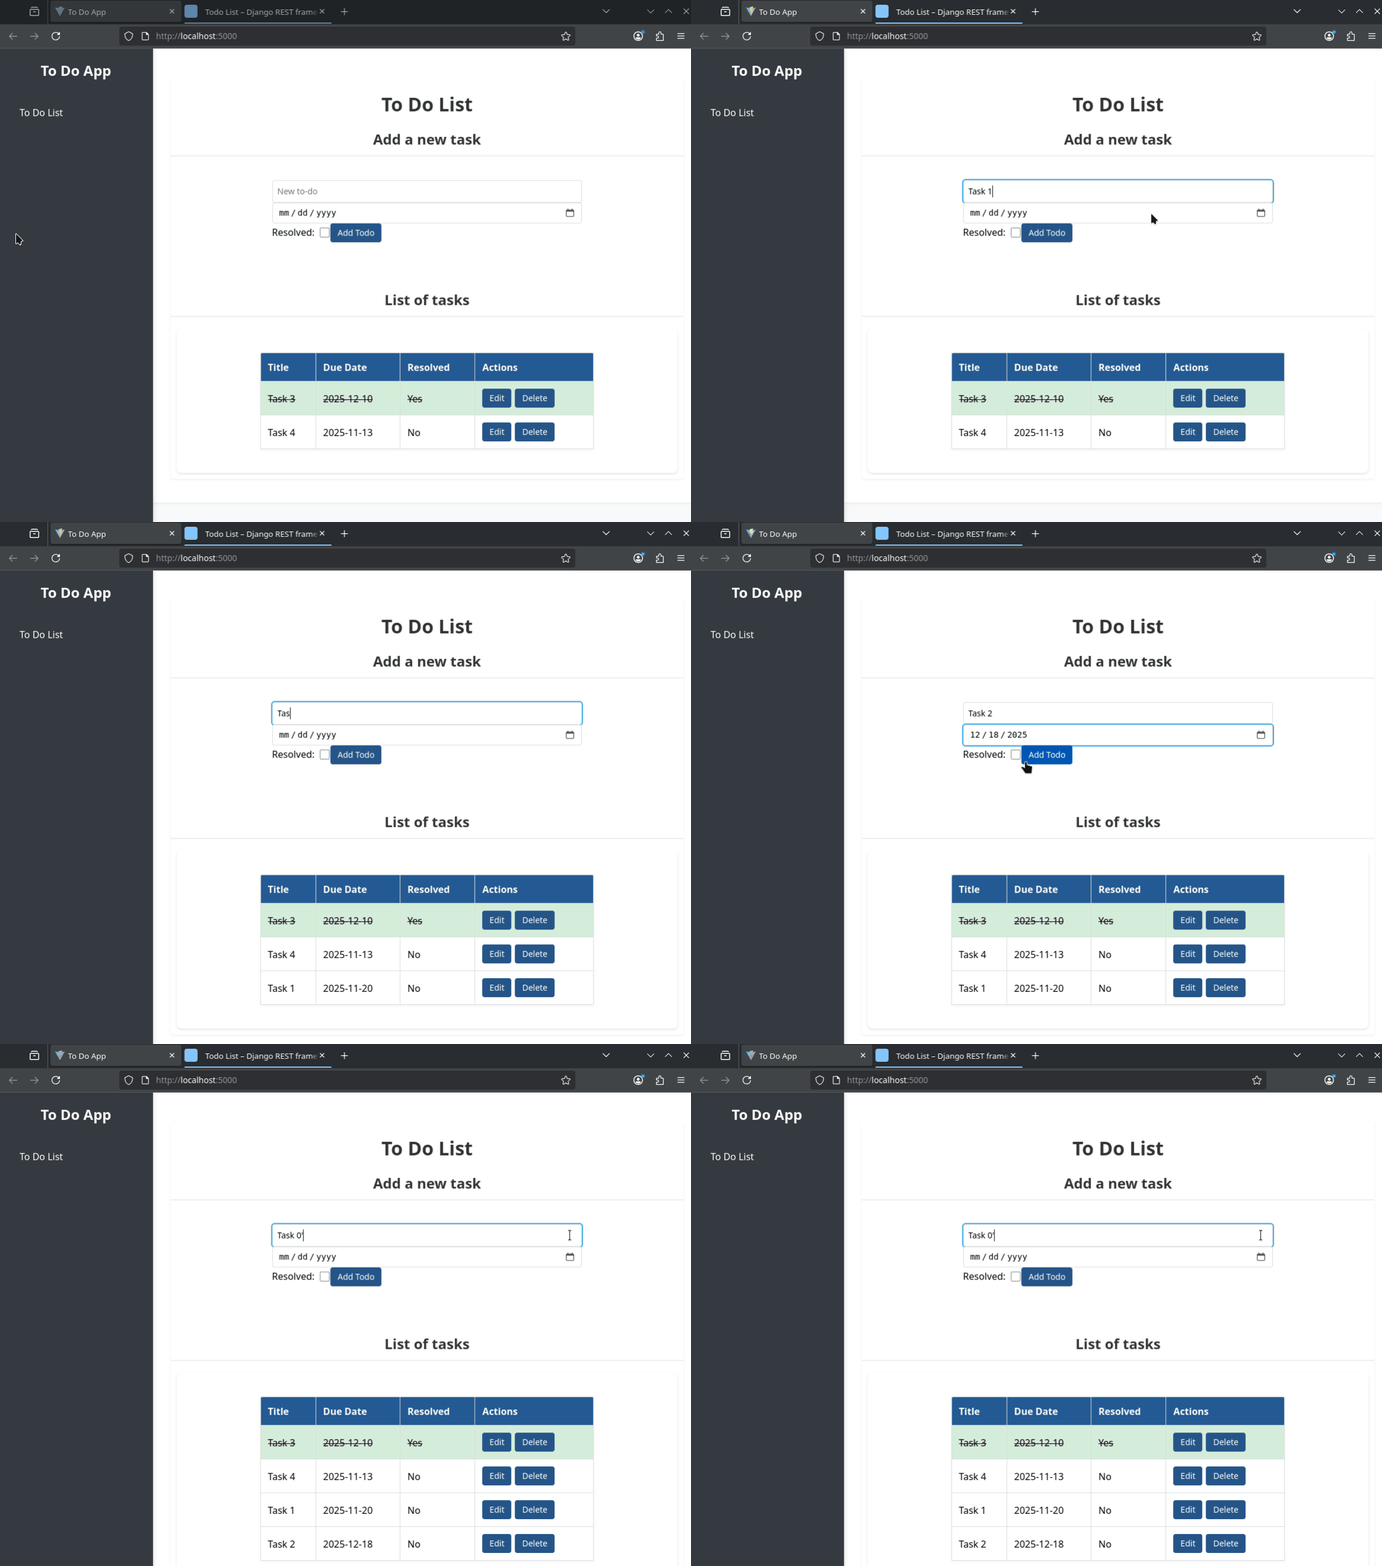
Python Django & React - To-Do App
A simple To-Do application built with Django and React (JavaScript). It provides an easy-to-use platform for users to create, edit, and delete to-do tasks, with a focus on clean, maintainable code and responsive design.
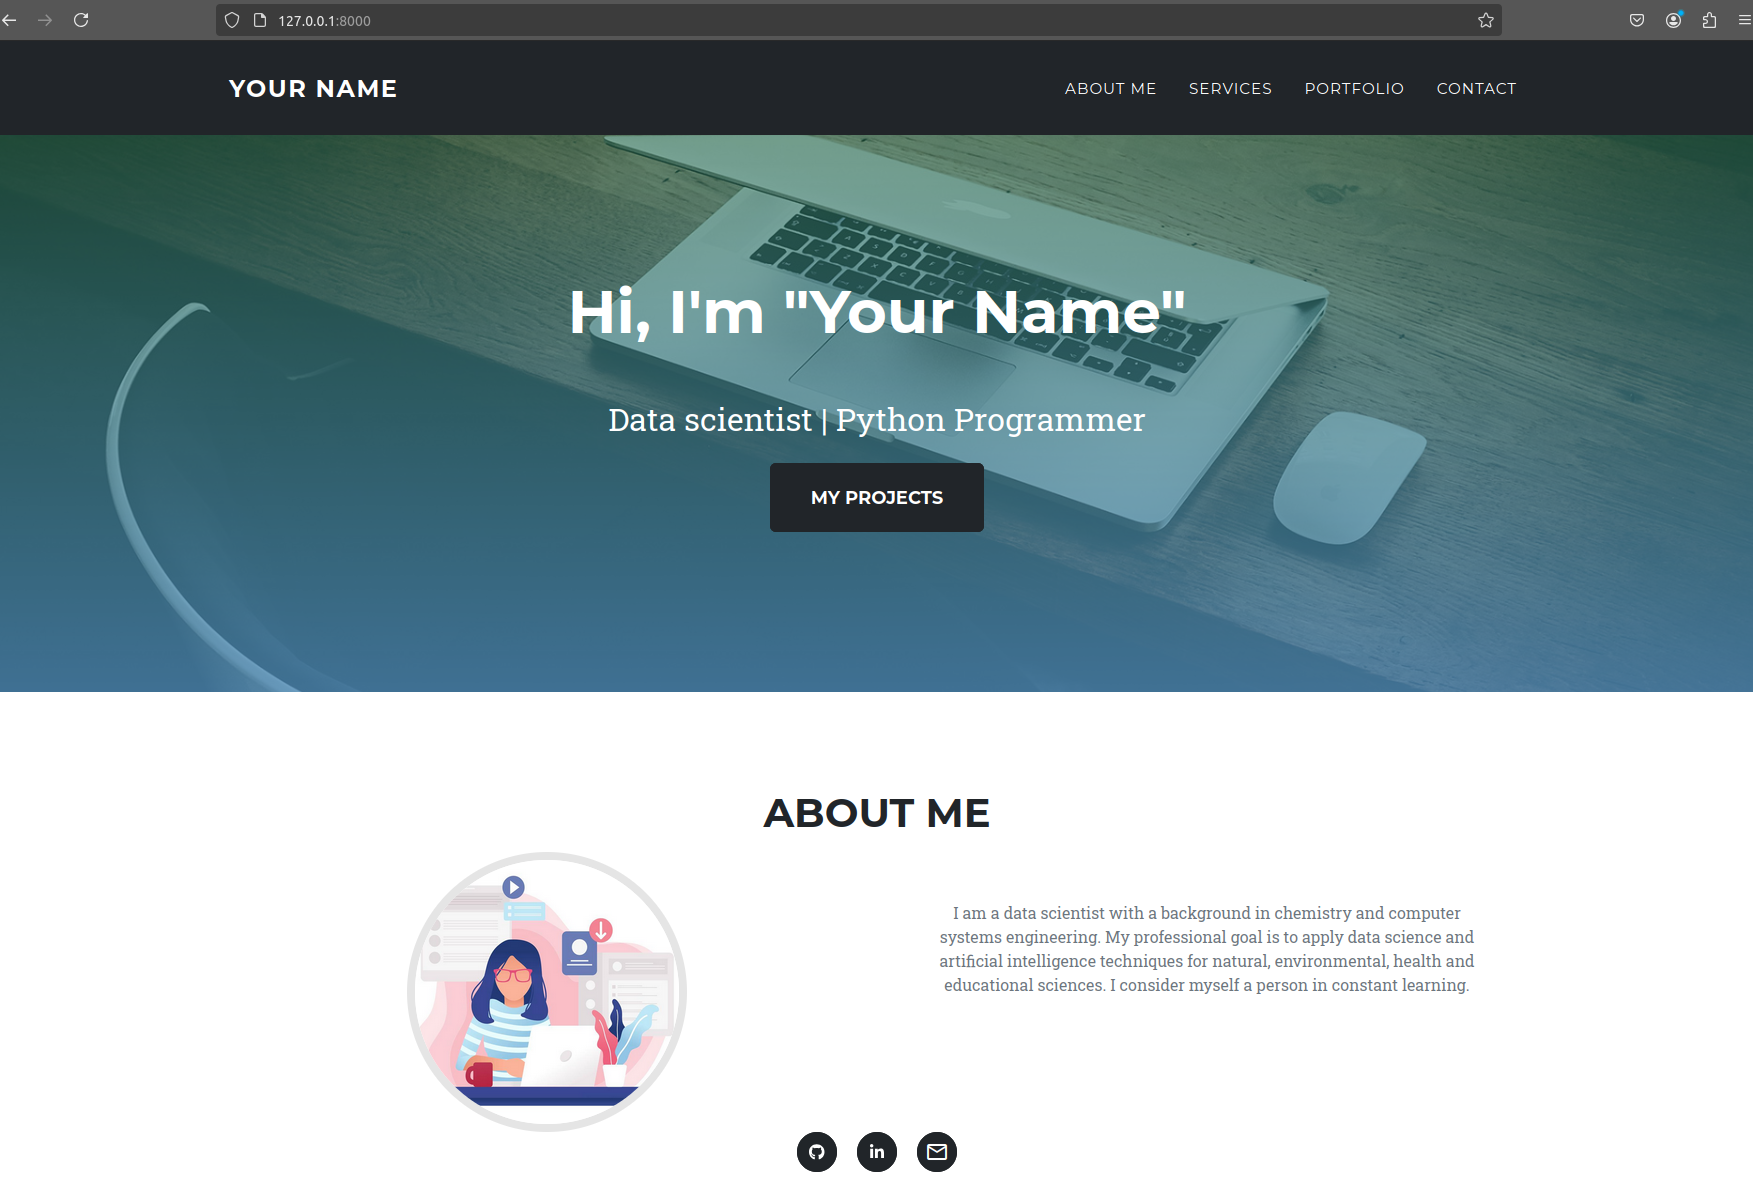
Django Portfolio Website
Python Django Portfolio Website
This is a Python Django-based personal portfolio website. The fronted is based on the Start Bootstrap Agency Template .
Python Flask - Weather App
Weather App using Python Flask framework, OpenWeatherMap API and bootstrap.
Python - Remote Work & Mental Health
Python Data Analysis - Remote Work & Mental Health
Exploratory Data Analysis of the impact of remote work on mental health of individuals across various demographics. The dataset includes key metrics such as job satisfaction, anxiety levels, and work-life balance. Exploratory data analysis (EDA) was performed using Pandas and Plotly (Python libraries).
Python Data Analysis - Water potability
The dataset analyzed includes water quality metrics for 3276 different water bodies: pH, hardness, solids, cloramines, sulfates, conductivity, organic carbon, trihalomethanes, turbidity and potability. Exploratory data analysis was performed using Pandas and Seaborn (Python libraries).
Tableau - World staple food crops (2000 - 2021)
Tableau - World staple food crops (2000 - 2021) dashboard
The dataset analyzed was about the global staple food crop production. Data was obtained from the Food and Agriculture Organization (FAO) website in 2023. Exploratory data analysis (EDA) and data visualization were done using Tableau.
Tableau - E-Commerce Revenue UK retailer
Tableau - E-Commerce Revenue UK retailer dashboard
This is a transnational dataset which contains all the transactions occurring between 01/12/2010 and 09/12/2011 for a UK-based and registered non-store online retail. The company mainly sells unique all-occasion gifts. Exploratory data analysis (EDA) and data visualization were done using Tableau.
SQL and Power BI - Exploratory Data Analysis (EDA) of US Breweries
SQL & Power BI - US Breweries dashboard
Dataset of US breweries. Includes: Number of barrels, costs, number of employees, etc. Exploratory data analysis (EDA) was performed using SQL and the data visualization was done using Power BI.
Looker Studio Data Studio - Google Ads
Looker/Data Studio Studio - Google Ads dashboard
Google Ads report Report for a company. The exploratory data analysis (EDA) was performed using google spreadsheet and visualization was done using Looker/Google Data Studio.

Contact


Send me a message